Weather and Climate Visualization
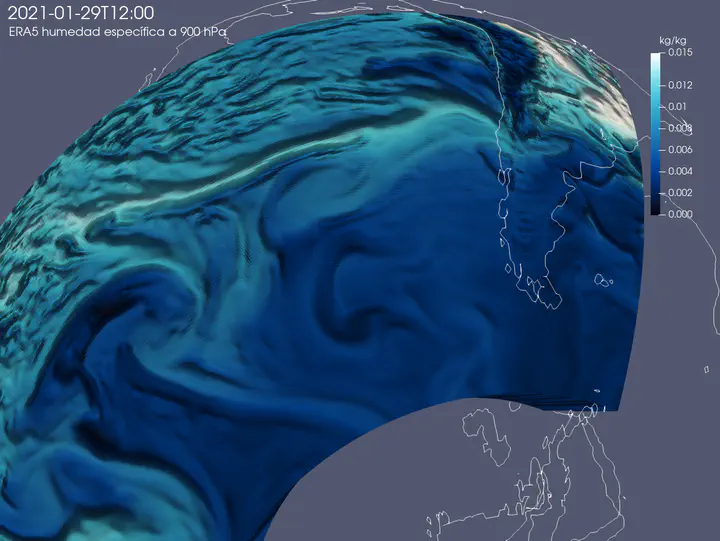 Water vapor in the form of atmospheric river hitting the coast of Chile
The myriad of weather and climate data available today makes even more necessary to find the best way to display the information in a meaningful way so that the communication is effective. This project explore different approaches to create visualizations from weather and climate data.
On going initiatives include:
- Monitoring weather data from UOH meteorological station (UOHmet)
- Monitoring disdrometer data at ARO in Universidad de Concepción (visor-parsivel)
- Display rainfall data in a cyclical way (Sala de Lluvias)
- Building 3D visualizations with Paraview
Future ideas to be addressed by UOH students include:
- Improve monitoring data of UOHmet
- Create interactive visualization for UOHmet
- Animate 3D or 4D data from ERA5 reanalysis in Paraview
- Explore new and creative ways to visualize weather and climate data
Raúl Valenzuela
Assistant Professor
My research interests include precipitation processes related to Atmospheric Rivers and complex terrain, forecast verification statistics, and GPS meteorology.